To follow on from my last post, having data showing the load on your server throughout the day is great, but what do you do with it and how do you interpret the information?
Looking through the data I could see clear short periods where the load average would sky rocket, into double figures and into the 20's. From every article and post I'd seen it said that if the load divided by the number of cores/threads was more than one you have a problem. No ifs, no buts, you have a problem. I was seeing 20+ on a dual cpu server... oh dear!
The problem was I couldn't see an obvious cause. CPU usage wasn't high, the idle time was good, memory was fine with the swap file not being used, the disk queue wasn't long, and the process list didn't show anything to indicate an issue.
Fortunately I came across a few fantastic explanations of Load Averages that explained where I (and it seems many others) had been going wrong. I've linked to them all below, and I recommend reading them for more info, but the upshot is that it's not as cut and dry as people make out.
To quote from Jon Emmons blog, the load average "is the average sum of the number of processes waiting in the run-queue plus the number currently executing over 1, 5, and 15 minute time periods.".
The load average is far more complex than many people make out, and while it can be a good initial indicator of a problem it must be examined in conjunction with other factors. It doesn't allow for the fact that a process could be waiting for not just the CPU, but also disk or network IO, and doesn't allow for the priority of the running/waiting processes in the queue.
If you have a long running low priority process running for instance, that will always make way for more urgent time critical requests. In the mean time that process will sit in the queue, and will cause the load average to increase. Add some more of these low priority processes, for instance a backup job, and the load average will increase, which indicates a problem. Higher priority processes like email, websites etc will be handled immediately however, causing no delay for users, and as such the reported high load isn't really an issue.
So the key is that it's fine to track the load average to indicate a possible problem, but don't rely on it for proof that you have one. Always remember to check the other figures provided to see IF you have a problem, not necessarily WHAT the problem is.
Tracking down the cause for high load on a server can be a challenge, especially when issues are happening when you can't keep an eye on it, but it's a challenge I've been facing recently. While there were no issues with the server's response, I discovered at certain times (often in the evenings) the load average would become high enough to cause Exim to briefly pause processing the mail queue.
After hunting round for a easy way to track the server's state I came across a simple script from Craig Edmonds that did the job. It very simply generates an email containing a variety of status information, including most importantly the process list data from Top, and sends that to you in an email. By scheduling the script to run every minute you get a snapshot of the servers state at regular intervals. Since the subject line includes the load average you can easily look through the messages, spot those times with a high load, and see what the server is doing.
In my case I adjusted the script slightly to include $todaydate in the subject line, since the above issue with Exim meant I couldn't always rely on the message being received in the correct order.
There was one problem I found with this solution. The script runs a single iteration of Top and inserts the output of that into the email, however as you can see from the Man page for Top :
The top command calculates Cpu(s) by looking at the change in CPU time values between samples. When you first run it, it has no previous sam- ple to compare to, so these initial values are the percentages since boot. It means you need at least two loops or you have to ignore sum- mary output from the first loop. This is problem for example for batch mode. There is a possible workaround if you define the CPULOOP=1 envi- ronment variable. The top command will be run one extra hidden loop for CPU data before standard output.
each email I received had identical CPU data. While I could tell the server's load was high, I couldn't see what the state of the processor was at that time. I didn't fancy messing around with environment variables, so instead opted for a solution found here, and adjusted the line calling Top as follows :
So I found a simple and easy way to track what's happening on the server, though of course with an email a minute it's not something I'll be running long term.
I wish I could say that was the end of it, but unfortunately this turned out to be the beginning of my struggle and confusion, brought on in no small part to the number of confused explanations of Load Average operations, but I'll discuss that in my next post.
When it comes to moving databases there a number of different methods that you can use. The best method will depend on the situation, but most comments/guides/blogs online concentrate on moving individual databases, either by importing/exporting/copying the data between servers using SSMS, backing up and restoring the databases, or detaching and attaching them.
The method described here is a way to move all of the MS SQL databases from one server to another. The basic idea is to stop all of the MS SQL Server services on both servers, copy all of the data files including the system database files (eg the .mdf, and .ldf files) to the same location(s) on the new server, and then start SQL Server on the new server.
There are a few key points to note about this method when considering if it is suitable to your situation :
The new and old servers must have the same version and build of SQL Server installed.
The file paths for your data files must be the same on both servers.
It doesn't matter if the two servers have different names.
The new server must have enough storage space to hold the data files in their current location.
Depending on the amount of data this method can involve a long window of downtime while the data copies over the network
Before stopping SQL Server and starting the move it's worth considering any housekeeping tasks that might need doing. A couple of things I've done before starting a move :
Remove any old / unwanted databases. This process moves all of them, so if they're no longer required why waste time copying a database you don't need.
Consider shrinking database files. Keeping your transaction log files large can avoid situations where the file has to grow, and shrinking isn't generally recommended, however, copying gigs of empty space over a network will needlessly increase the time this process takes. Therefore it may be worth shrinking the file initially, and then manually increasing it again once it's running on the new server.
The steps to the move are :
Install SQL Server on the new server, ensuring it's the same version and build as the old server, and with the same options installed. Ensure that your system database location is configured to be the same as what you have on the old server.
Stop all of the SQL Server services on both servers.
Copy all of the database mdf, ldf and ndf files from the old server to the new server, including all of the system database files. Each file must be copied to the same location on the new server as it was on the old server, otherwise SQL won't be able to find them when when it starts.
Copy any other related files that will be required, eg if any jobs are configured to access or use files on the server then copy them as well.
Start the SQL Server services on the new server.
Open SSMS and confirm that all of the databases are being shown and are accessible.
Either update your application(s) or site(s) to use the new server, or change the server name and network details to match that of the old server so they can connect with the existing details.
Test and confirm that everything is working correctly.
Notes:
I've successfully used this method on SQL Server 2008 R2, however it should also work on all other versions and in fact other people have confirmed it to work with SQL 7 and 2000.
The installations were fairly straight forward setups, with no replication, clustering, Analysis or Reporting services configured, so while I doubt they would stop this from working I can't confirm that for certain.
If you're unsure of the exact setup of your existing installation, check the "Server Server Installation Center" on the old server, go to Tools, and click on "Installed SQL Server features discovery report". This will generate a report showing all of the components installed and what build that are currently.
Continuing on the theme of monitoring servers, I've been working on monitoring the available disk space on a number of our servers using PowerShell. My original intention was to call this from IPMonitor, but unfortunately that doesn't seem to reliably pick up the changing result fed back from the script, which obviously makes it a somewhat useless as method monitoring! In addition, while I could monitor these things on the servers themselves, I felt that left too much scope for a problem on the server also preventing alerts being generated to let us know.
Writing the script turned out to be quite a challenge, considering my limited experience with PowerShell, but it was certainly an exciting one. As it progressed the complexity slowly increased, sometimes due to the realisation that I hadn't taken something into account, for instance checking the script could even connect to the target server, and other times simply as I thought of additional ways I could improve and expand the functionality. To say I learnt a lot from the process would be an understatement, and I thought I'd share some of those discoveries with all of you.
First of all though is the script itself. As you can see below, I wrote it to be as generic as possible so anyone could easily use it again for another server, simply by adjusting the few details at the top. The script connects to the specified server, and loops through a list of drives testing that each one has more that the configured minimum disk space available. Since the requirement is different for each drive, this is configured individually per drive rather than script wide. If the test fails then the script generates an error e-mail including details of the available space, and the configured threshold. Now since I wanted the ability to run the script fairly regularly, but didn’t want to be constantly bombarded with alerts, the script keeps a record of when an alert has been sent, counts the number of times the test has failed since the alert and then doesn't send another one for a defined number of times. Finally, once the test passes again (eg you've resolved the space issue on the server), the script sends a notification to confirm that and resets the counters.
# Remote space monitoring script - by Keith Langmead 02/03/2011 # Script connects to a remote server and checks the available disk space on each specified drive # the monitored drives and their individual thresholds are stored in the $serverdrives hash. # For each failure an e-mail alert is generated the first failure, repeat alerts are generated # at the frequency specified in $alertthreshold, and once the available space is above the # threshold again a recovery e-mail is generated. # ------ Config Section ------- $mailfrom="Alert Address <alert@domain.com>" $mailto="Keith Langmead <me@domain.com>" $mailserver="mail.domain.com" # contains drives to be monitors, "<drive letter>"=<min mb> with multiple drives separated by a semi-colon $serverdrives=@{"c"=30000;"e"=15000;"f"=20000;"g"=20000} $servername="My Server" $serverip="192.168.0.1" # specifies how many times to skip alerting [INT]$alertthreshold=12
# --------------------------------------- # Function code from http://halr9000.com/article/506 functiondf ( $Path ) { if (!$path) {$path= (get-location-psproviderfilesystem).providerpath} if (!($Drive= (get-item$path -ea silentlycontinue).root -replace"\\")) {$Drive=$Path} $output=get-wmiobject-query"select freespace from win32_logicaldisk where deviceid = `'$drive`'"-computername$serverip-Credential$myCred return [INT]"$($output.freespace / 1mb)" }
if (test-connection-computername$serverip-Quiet) { write-host"Connection to $servername successful" # Loop through the list of drives specified above foreach ($sdin$serverdrives.keys) { $sdpath=$sd+":" # Define the environment variable names for the current drive $envVarServerFail="spaceMonitorEmail"+$servername+$sd.ToUpper() +"fail" $envVarServerCount="spaceMonitorEmail"+$servername+$sd.ToUpper() +"count" # Call the DF function to find available space on current drive $currentspace=df$sdpath # If the available space is above the threshold if (($currentspace) -gt$serverdrives.Get_Item($sd)) { write-host"Space is fine on "$sd":" # If the test previously failed generate a recovery e-mail if ([Environment]::GetEnvironmentVariable($envVarServerFail, "User") -eq1) { $minspace=$serverdrives.Get_Item($sd) $driveletter=$sd.ToUpper() $mailsubject="[Notifier] $servername Disk Space Notification $driveletter Drive Recovered" $bodytext="The free space on $sdpath is back above specified limits. Current space available is $currentspace MB and the threshold for alerts is $minspace MB" send-mailmessage-from$mailfrom-to$mailto-subject$mailsubject-body$bodytext-smtpServer$mailserver write-host"recovery e-mail sent" } # Reset the environment variables to 0 [INT][Environment]::SetEnvironmentVariable($envVarServerFail, 0, "User") [INT][Environment]::SetEnvironmentVariable($envVarServerCount, 0, "User") } else { # If the test failed and it's either the first time or the failure count is above the alert threshold send a notification if ([Environment]::GetEnvironmentVariable($envVarServerFail, "User") -eq0-OR [INT][Environment]::GetEnvironmentVariable($envVarServerCount, "User") -gt [INT]$alertthreshold) { $minspace=$serverdrives.Get_Item($sd) $driveletter=$sd.ToUpper() $mailsubject="[Notifier] $servername Low Disk Space Notification $driveletter Drive" $bodytext="The free space on $sdpath is getting low. Current space available is $currentspace MB and the threshold for alerts is $minspace MB" send-mailmessage-from$mailfrom-to$mailto-subject$mailsubject-body$bodytext-smtpServer$mailserver write-host"failure e-mail sent" # Set fail and count to 1 or reset count back to 1 [INT][Environment]::SetEnvironmentVariable($envVarServerFail, 1, "User") [INT][Environment]::SetEnvironmentVariable($envVarServerCount, 1, "User") } else { # If the test failed, it's not the first time and not above the alert threshold increment the count [INT]$incFailVar= [Environment]::GetEnvironmentVariable($envVarServerCount, "User") [INT]$incFailVar=$incFailVar+1 [INT][Environment]::SetEnvironmentVariable($envVarServerCount, $incFailVar, "User") } } # --- Start Debugging info - so you can see what is happening when running manually, you can remove this section if you want write-host"Current space on "$sd": is"$currentspace" MB with minimum threshold of "$serverdrives.Get_Item($sd) "MB" $foo1= [Environment]::GetEnvironmentVariable($envVarServerFail, "User") write-host$envVarServerFail"equals "$foo1 $foo2= [Environment]::GetEnvironmentVariable($envVarServerCount, "User") write-host$envVarServerCount"equals "$foo2 # --- End Debugging info } } else { write-host"connection to $servername failed, script aborted" }
I think I'll leave it there for today, but I will be back to write more about the issues I found, including using user level Environment variables, hash tables and type setting.
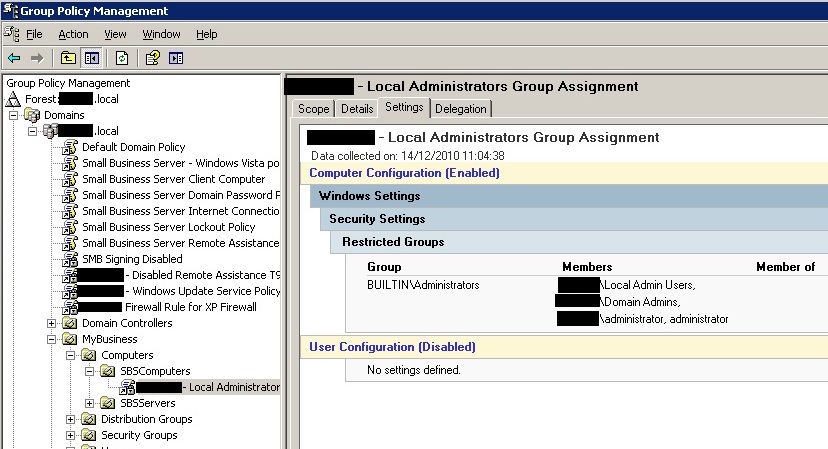
I recently needed to setup a restricted groups group policy for a client, and discovered that the instructions available online are incomplete at best, inaccurate at worst. After fiddling with the settings and trying various things I managed to get it working, so I thought I'd share what I found.
Restricted groups certainly aren't anything new, they've been available with Windows Server GPO's for several versions now. They allow you within a domain GPO to specify the membership of a specific group on the target machines, therefore saving you the hassle of doing it manually.
In this instance the aim was to grant local administrator permissions to a selection of users, but only to the client machines on the network, not the servers. Eg, those users could make changes, install software etc on the desktops and laptops within the companies network, but could not login to the servers, and therefore gain access to data they were not authorised to view.
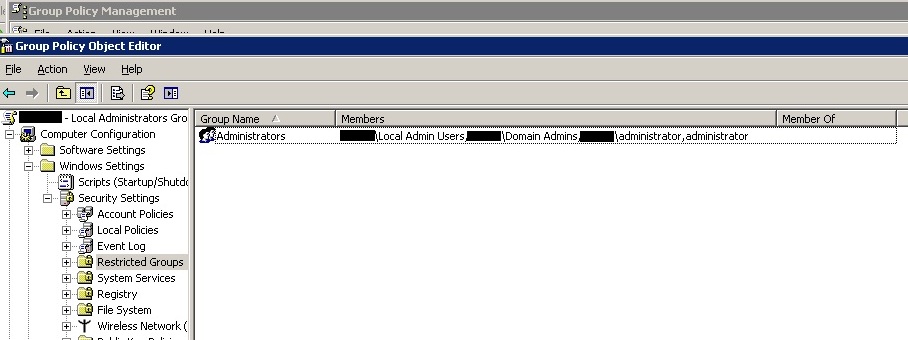
A reasonable guide can be found here, however, the critical ommission is that the "Group Name" MUST be the name of the group that you want the users / groups to be a member of on the client machines. The instructions indicate that it's controlled by "Member Of", however from testing that appears not to the the case.
So to add MyAdminGroup to the Administrators group you would set :
Group Name = Administrators Members = MyAdminGroup, Administrator, \Domain Admins, \administrator Member of = empty
All the guides I've seen show the group name in their examples as being "Administrators", but make no reference to this being anything other than a simple name. When I first attempted it, I called the group "Local Admins", and then added "Administrators" (and a few other variations) to the Member of section, with no effect.
Note: When using Restricted groups you need to include the existing groups as well as the new ones, as this policy replaces rather than amends the existing group membership.
So continuing from my last post, after getting my monitoring script to work, I set about trying to introduce some semblance of security to at least partially hide the plain text password held within the script.
My initial success was through the use of the ConvertTo-SecureString and ConvertFrom-SecureString cmdlets. Essentially (or least as far as I understand it), the first of these converts some form of password string into some kind of system value, eg if you try simply outputting the contents of $password in the first script, it simply returns something like 'Secure-String', rather than a representation of the password itself. The second cmdlet converts that system value into an actual string value, though it's encrypted rather than the original ascii text as we'll see shortly.
So, my first task was to get hold of that encrypted version of the string, so I could then put that direct into the script, and use it in place of the plain text password. Using the following code I encrypted the password and then outputted it into a text file.
Extracting the resulting string from the text file, I added it into my script, and then adjusted the ConvertTo-SecureString line to receive an encrypted string rather than a plaintext one as you can see below.
To my relief this then worked, exactly like the original script! Filled with joy (ok, maybe not joy, but certainly pleased with myself), I updated the monitoring system to use the new script, set it running, and can you guess what happened? Yep, it failed. I went through all the settings, they were fine. I switched back to using the old script, it worked again.
After scratching my head for a while I had an idea, possibly a crazy one, but worth a try. I set the monitoring system to execute the script that generates the encrypted password so I could see what the output would look like. It was completely different to the one outputted direct on the server! I re-ran the server version, and sure enough, it produced the same output as it did the first time.
Clearly something about the encryption process used in ConvertTo-SecureString is dependant on where it is run. I updated the script with the new string, set the monitoring system going again, and finally it worked!
So the lesson here is that if you try this yourself, what ever system you are using to call your script, you must also get it to call the encryption script as well, and use THAT output to populate your monitoring script with its password.
Recently I've been trying to find a way to use a combination of PowerShell and our monitoring system IPMonitor to check connections between two sites.
Picture the scene, three different sites, A, B and C. At site A we have a monitoring system to check various aspects of the services we look after, sites B and C contain various servers, with VPN links joining A to B, A to C and B to C. From A I can check that the VPN links to B and C are up, but what about the link between B and C? That's where I figured PowerShell could come in handy.
After a bit of searching I found the test-command cmdlet which not only allows you to test a connection like you would with ping, but also to specify the source server to test from. After a little tinkering I came up with the following :
As you can see, running the script outputs either 1 or 2 depending on the result of the test. Within IPMonitor I then used an External Process Monitor to call the script, compare the script output with the test value (1 obviously), and then display if the connection is up.
The final piece to the puzzle was making the whole thing at least a bit more secure. For the terminally paranoid, having a script sat there containing a server password doesn't really fill you with joy, so I managed to encrypt the password and use that instead. As it turned out though, doing that in conjunction with IPMonitor turned out to be harder than expected, but I'll go into details on that later.